SEO Reporting: 7 Search Console Metrics for Clients
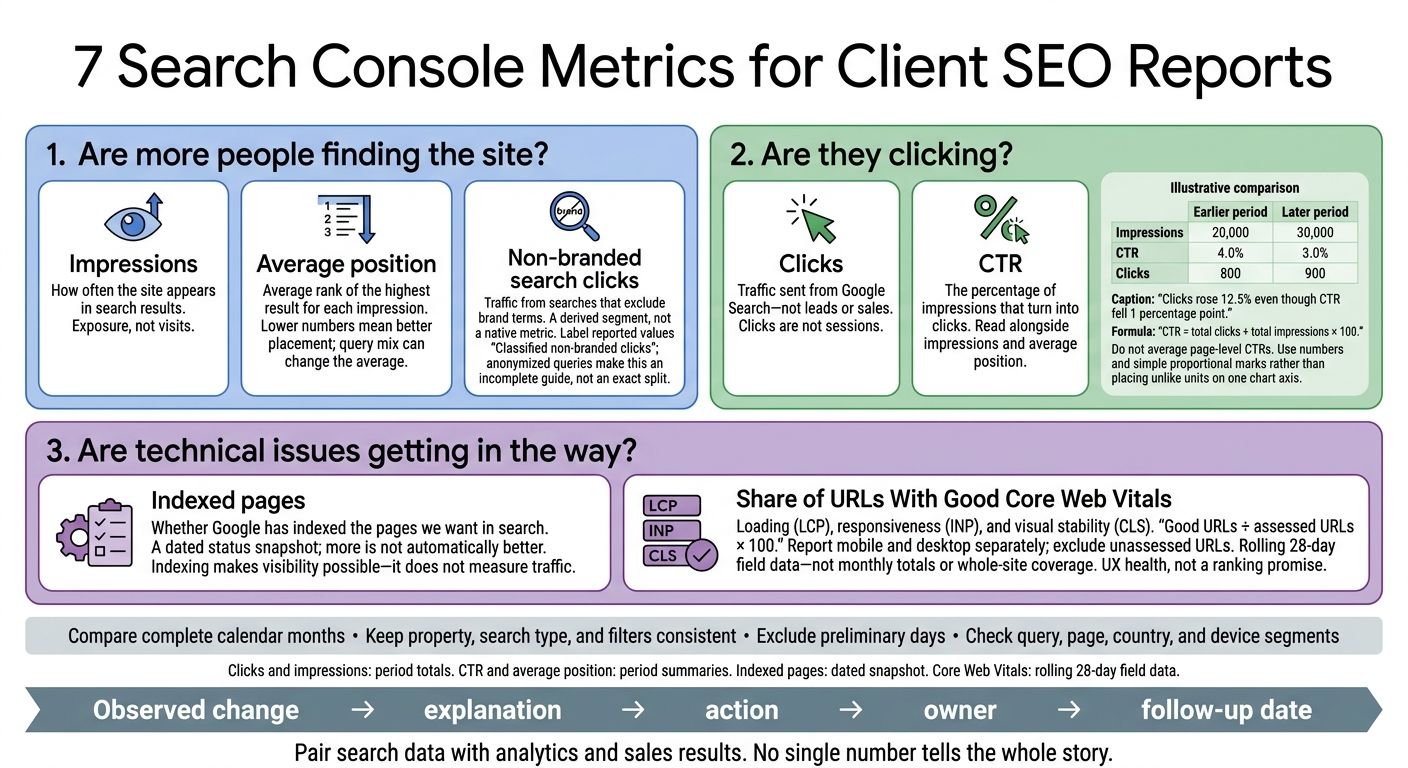
I use seven Search Console metrics to answer three client questions: Are more people finding the site, are they clicking, and are technical issues getting in the way? Before recommending changes, I compare complete months with the same filters and analyze your SEO performance and check which pages and queries drove the results.
· · 15 min read

On this page
I use seven Search Console metrics to answer three client questions: Are more people finding the site, are they clicking, and are technical issues getting in the way? Before recommending changes, I compare complete months with the same filters and analyze your SEO performance and check which pages and queries drove the results.
Here’s what I track:
- Clicks: Traffic sent from Google Search - not leads or sales.
- Impressions: How often the site appears in search results.
- CTR: The percentage of impressions that turn into clicks.
- Average position: Ranking changes, checked alongside query mix.
- Non-branded search clicks: Traffic from searches that exclude brand terms.
- Indexed pages: Whether Google has indexed the pages we want in search.
- URLs rated Good for loading, responsiveness, and layout stability: The share of assessed URLs that pass Google’s user-experience checks, reported separately for mobile and desktop.
No single number tells the whole story. For example, 900 clicks from 30,000 impressions means a 3% CTR - but it doesn’t tell me whether those visitors became customers.
I pair search data with analytics and sales results, then end each report with an action, an owner, and a follow-up date.
Analyzing performance on Google Search
Set a Consistent Reporting Baseline
Use complete calendar months for month-over-month reports, and note differences in month length so clients can compare results clearly. Include the same month from the prior year when seasonality or promotions could skew the numbers. Document Pacific Time, which Search Console uses for daily reporting. A fixed baseline makes it easier to assess visibility, demand, and site health.
Keep the property, search type, and filters consistent. Record the search type and any query, page, country, device, or search appearance filters. Before recommending action on a changed metric, check query, page, country, and device segments to understand what drove the shift. Separate branded and non-branded queries, too.
Check the last-updated date and leave preliminary days out of final totals. If the latest dates are incomplete, label the reporting cutoff and exclude partial days.
Present each metric as measurement → change → interpretation → next step. Use commas for thousands, periods for decimals, and percentage points for rate changes. Include relative change only when it helps explain the result. Calculate overall CTR by dividing total clicks by total impressions - not by averaging page-level CTRs.
Label what each metric measures:
- Clicks and impressions: Period totals. CTR and average position: Summaries of the period.
- Indexed pages: A dated status snapshot to save for later comparisons. Core Web Vitals: Rolling 28-day field data, split by mobile and desktop - not monthly totals. Allow time for fixes to appear in this data.
Apply these reporting rules to the seven metrics below, starting with clicks.
1. Clicks
What It Measures
Clicks count how many times users selected a Google Search result that took them to your site. One person can generate multiple clicks, and clicks are not sessions.
Reporting-Period Change
Report the total clicks, percentage change, and absolute difference:
12,450 Google Search clicks, up 18% from the previous reporting period - 1,899 more clicks than before.
What It Means for Clients
Use the click total to assess whether search demand is bringing traffic to your site. More clicks usually mean more search traffic - not more leads or sales. Check which landing pages gained traffic, then confirm business results with analytics or CRM data.
If clicks increase while impressions stay stable, review average position and CTR for the affected pages and queries to see what changed.
Next Step
Let the direction of change guide your next move.
- For gains: Find the pages and queries driving growth, and keep what's working. If gains came from pages ranking near the top of page one, improve internal links, update relevant content, and monitor CTR without making unnecessary changes. If informational URLs gained clicks but service or product pages didn't, add internal links and calls to action that direct visitors to conversion pages.
- For declines: Start with the largest losses by click count and business value. Compare affected URLs and queries with the previous period. Then segment by page, query, device, country, and date before recommending a fix. Check whether rankings, impressions, CTR, indexing, or search appearance changed first.
2. Impressions
What It Measures
Impressions count how often your site’s links appear in Google Search, based on Google’s rules for each result type. For standard results, an impression counts when the results page loads - even if the user never scrolls far enough to see your link. Some formats, such as carousels or expandable elements, only count when scrolled into view or expanded.
Reporting-Period Change
When clicks change, impressions help show whether visibility changed first. Report impressions for the current and comparison periods, plus the percentage change, alongside clicks, CTR, and average position. Increases may come from appearing for more queries, better rankings, new content, or higher search demand.
What It Means for Clients
Impressions measure search exposure, not visits. If impressions rise but clicks stay flat, your site is usually appearing for more searches without bringing in more traffic. That can show visibility growing before clicks follow.
Check newly appearing queries and their rankings before blaming titles or descriptions. This context helps you judge whether click changes came from more visibility or a higher CTR.
Next Step
Compare Queries and Pages, then group search terms by topic, intent, and brand status. For growing topics, improve content, titles, and internal links before adding more pages. For declining topics, check search demand, rankings, indexing, and canonicals.
3. Click-Through Rate
What It Measures
Click-through rate (CTR) is the percentage of impressions that lead to clicks: clicks ÷ impressions × 100. Google Search Console reports CTR alongside clicks, impressions, and average position.
Reporting-Period Change
At 20,000 impressions and 4.0% CTR, clicks total 800. At 30,000 impressions and 3.0% CTR, clicks total 900 - up 12.5% even though CTR fell 1 point.
What It Means for Clients
When impressions change faster than clicks, CTR helps show whether visibility is turning into traffic. Read CTR alongside position and impressions. Changes in rankings, query mix, or search-result features can shift the rate without pointing to weaker copy.
Next Step
If CTR lags behind impressions, start with the queries getting the most impressions. Investigate before rewriting. Look for lower-than-usual CTR, especially for queries ranking near the top of page one. Check search-result features, too; Search appearance covers recorded result types only.
Before changing copy, review the query’s intent, the visible title and description, and the page’s ranking. If the title or snippet misses that intent, test one change that accurately reflects the page. Record the change date, then compare clicks and business outcomes over the next period of equal length.
4. Average Position
What It Measures
Average position is the average rank of your highest result for each impression. Lower numbers mean better placement. At the property level, Search Console uses your site’s top result. At the page level, it uses the URL’s top result. It’s not a fixed rank for every keyword.
Reporting-Period Change
A move from 12.0 to 8.0 is an improvement of 4.0 positions - not proof of traffic growth.
Check which queries or pages moved. If clicks or impressions dropped, find out which queries lost visibility before calling the change an improvement.
What It Means for Clients
A sitewide average can mask weak non-branded commercial visibility behind strong branded performance. It can also improve simply because low-ranking queries stopped getting impressions. It measures ranking visibility - not the value of your traffic.
Next Step
Perform a branded vs non-branded query analysis, then review the pages and high-impression queries behind the change. Branded demand can lift the average without improving non-branded visibility, so check both groups before judging progress. Focus content updates and internal links on relevant pages gaining clicks. Before making sitewide page changes, identify which queries lost impressions.
5. Non-Branded Search Clicks
What It Measures
This segment narrows click analysis to generic searches. Non-branded clicks are a derived segment, not a native metric. Start by defining your brand list. Then exclude brand names, product names, branded services, domain variations, abbreviations, and common misspellings.
Reporting-Period Change
Compare both the segment’s click count and its share of total clicks:
Non-branded click share = classified non-branded clicks ÷ total clicks × 100.
If total clicks increase while non-branded clicks fall, stronger brand demand - not discovery through generic searches - may be driving growth.
What It Means for Clients
Use the label Classified non-branded clicks to show how much traffic comes from generic searches. Anonymized queries mean this split is a guide, not an exact count. It helps clients see whether growth comes from people finding the site through generic searches or searching for the brand.
Next Step
Once you’ve separated branded traffic, check where generic clicks are increasing or falling. For declines, review the affected queries and landing pages.
Falling impressions can point to reduced visibility. A drop in average position suggests ranking losses. If impressions and position are mostly stable, check titles, descriptions, and search-result features. Prioritize high-impression queries in positions 4–20.
Map each query to its ranking URL. Then address title issues, coverage gaps, weak internal links, or cannibalization.
6. Indexed Pages
What It Measures
Indexed pages are URLs Google has added to its index and can show in Search. In Search Console > Indexing > Pages, check the indexed total and the groups of excluded URLs.
Reporting-Period Change
Compare the indexed count with the previous period, noting any launches, removals, or migrations. If published or submitted URLs increase but indexing stays flat, review the affected groups. A drop can be good when duplicates are consolidated - or a problem when priority pages fall out of the index.
What It Means for Clients
Indexing makes visibility possible; it doesn't measure traffic. Focus on indexed canonical pages rather than a higher total. Report the share of priority product, service, or location URLs that are indexed, and separate intentional exclusions from problems.
Then check whether indexed priority pages get impressions and clicks. Indexing tells you whether a page can rank; performance tells you whether it does. Check this technical requirement before judging traffic growth.
Next Step
Use URL Inspection to check representative URLs from each affected group. Confirm which pages should be indexed, then review crawl access, accidental noindex tags, HTTP status, and Google’s selected canonical. Fix blocking directives, errors, or incorrect canonical signals on priority pages. Leave valid duplicate exclusions alone.
For Crawled - currently not indexed URLs, review content usefulness, duplication, and internal links before requesting indexing. A sitemap or indexing request doesn't guarantee inclusion.
Once priority URLs are indexed, check whether they also pass Core Web Vitals.
7. Share of URLs With Good Core Web Vitals
What It Measures
Once priority URLs are indexed, check whether they load and respond well enough to compete.
Core Web Vitals score = Good URLs ÷ assessed URLs × 100. Report mobile and desktop separately, and exclude unassessed URLs.
Core Web Vitals measure loading (LCP), responsiveness (INP), and visual stability (CLS).
Reporting-Period Change
Show changes for mobile and desktop separately.
A drop from 82% to 64% is an 18-percentage-point decline, not an 18% decline.
Include counts for Good URLs, assessed URLs, and affected URLs, along with problem types and the status of fixes.
What It Means for Clients
This measures UX health, not traffic. Search Console groups similar URLs, often by template. The results reflect grouped field data over time - not a page-by-page audit.
Because unassessed URLs are excluded, the percentage doesn't describe whole-site coverage.
Next Step
Focus on affected templates rather than individual pages. Check server response times, heavy scripts affecting INP, image weight affecting LCP, and layout shifts affecting CLS.
Change one thing at a time so you can tell what helped. Then give field data time to reflect those improvements before judging the results.
Comparison Table: What Each Metric Shows
Use this table for a quick client readout of Search Console changes. It connects each metric to a client question about traffic, visibility, or technical health, helping you decide what to investigate before ranking fixes.
| Metric | Client question answered | Positive movement | Warning signal | Recommended investigation |
|---|---|---|---|---|
| Clicks | How much organic traffic did Google Search send us? | More clicks to priority pages from relevant searches. | Clicks drop while impressions stay steady. | Break down results by query, landing page, device, country, and search appearance. Check whether ranking or CTR losses explain the drop. |
| Impressions | How often did our pages appear in relevant searches? | More exposure for target topics, products, or markets. | Impressions grow without clicks, or unrelated queries drive the growth. | Find the query and page groups gaining impressions. Review their relevance, positions, and search-result features. |
| CTR | How well did our listings persuade searchers to click? | Higher CTR for comparable queries, pages, and positions. | CTR drops for high-value searches. | Find queries with high impressions and low CTR. Review search intent, titles, and snippets. Check rich-result eligibility. |
| Average position | How high did we rank for the measured queries and pages? | A lower average position number for priority queries. | The number rises, or an improving average hides losses on important terms. | Compare query and URL groups. Separate branded from non-branded searches and mobile from desktop. Check whether a shift in query mix explains the average. |
| Non-branded search clicks | Are we attracting people who didn't search for our brand? | More clicks from relevant searches that exclude brand terms. | Total clicks grow while non-branded clicks stall or fall. | Verify exclusions for brand names, products, domains, and misspellings. Then review affected topic clusters, landing pages, positions, and CTR. |
| Indexed pages | Has Google indexed the pages we want eligible for search? | Intended, relevant priority URLs become indexed. | Important pages leave the index, or unwanted duplicate, filtered, or unintended URLs inflate the count. | Check sitemap coverage, indexing reasons, canonicals, noindex directives, redirects, and server errors. |
| Share of URLs With Good Core Web Vitals | How consistently do important pages deliver a healthy user experience? | A greater share of eligible URLs is classified as Good. | More URLs become Poor or Needs improvement, especially in priority page groups. | Find affected device and URL groups. Use PageSpeed Insights to diagnose LCP, INP, or CLS issues. |
Build a Prioritized Client Action Plan
Use the table above to turn metric changes into a prioritized work queue. Compare metrics before assigning work, without assuming one cause explains every change. Pair clicks with impressions, CTR with average position, and non-branded clicks with total clicks to separate changes in traffic, visibility, and click quality.
After diagnosis, keep indexing and user experience separate. If indexed pages drop while Core Web Vitals stay stable, investigate crawling and indexing first. If indexing stays steady but Core Web Vitals worsen, focus on performance work for the affected templates. When both decline, coordinate technical SEO and engineering work on priority URLs. Report Core Web Vitals improvements as user-experience gains - not ranking promises.
Rank actions by business impact, URL scope, confidence, effort, and urgency. A confirmed indexing problem on important pages should generally come before a title rewrite based on a hunch. Give each task one accountable owner and define success before work begins. That might mean restoring indexing for intended URLs, improving CTR for a specific query group, or reducing the number of URLs classified as Poor.
Make the action plan the report’s final output. End each report with this sequence:
Observed change → explanation → action → owner → follow-up date
Separate confirmed findings from hypotheses, and state what evidence would test each hypothesis. Set separate checkpoints for implementation and results. A completed fix doesn't mean its search impact can already be measured.
At follow-up, use the same filters, device segment, URL group, and time window. Check whether the intended change happened before expanding the work. Wait about four weeks before measuring the impact of title or description tests.
Conclusion
Use the seven metrics as one scorecard for client decisions: clicks, CTR, impressions, and average position track visibility and traffic. Non-branded clicks show reach beyond brand demand, while indexed pages and Core Web Vitals show whether technical health supports discovery and user experience.
For month-to-month comparisons, keep the property, search type, date range, and filters consistent. Compare current and prior periods using both absolute and percentage changes. Always include absolute counts - percentages alone can make small numbers look misleading.
Organize the client message around what improved, what declined, and what happens next. Connect visibility to traffic, then explain how the next action supports the client’s business goals.
FAQs
Why don't Search Console clicks match analytics sessions?
Search Console clicks and analytics sessions measure different events, so they won’t match exactly.
Search Console records clicks before a page loads and assigns them to canonical URLs. Analytics records sessions only when its tracking script runs, using its own timing and session rules.
A 10%–20% difference is typical. Larger gaps often point to missing analytics tags, redirects, or consent banners.
What is a good CTR for my site?
There’s no single “good” click-through rate (CTR). Rankings change the benchmark: a CTR that works well on page two may fall short for a top-three result.
To compare your site’s queries, group them by average position. If a query’s CTR is well below your site’s typical rate at that position, it points to a mismatch between user intent and your title or meta description.
How can I connect SEO metrics to revenue?
Start with your money pages: the pages and keywords that drive most of your traffic and income. Use the 80/20 rule to review Search Console data and find the 20% of pages that account for 80% of your results. Watch these pages closely - even small ranking drops can lead to large revenue losses.
Filter out branded search traffic, too. It can hide SEO growth and skew metrics such as click-through rate.