How to Prioritize SEO Fixes by Potential Traffic Gain
I prioritize SEO fixes by expected added clicks, effort, and confidence - not impressions alone. With 10,000 impressions, moving CTR from 2% to 3% would mean 100 more clicks over the same period, if impressions stay steady.
· · 9 min read

On this page
I prioritize SEO fixes by expected added clicks, effort, and confidence - not impressions alone. With 10,000 impressions, moving CTR from 2% to 3% would mean 100 more clicks over the same period, if impressions stay steady.
Here’s how I turn that estimate into a worklist:
- Start with matching data: Use the same 28-day Search Console window and filters for each query–URL pair.
- Set realistic targets: Base CTR and ranking goals on similar queries from my own site.
- Score each fix: Multiply projected added clicks by a confidence weight, then divide by work hours.
- Choose the action: Compare title edits, content updates, internal links, and fixes for competing pages without counting the same traffic twice.
- Check the outcome: Log changes, compare equal-length periods, and use the results to revise estimates.
My rule: treat click forecasts as estimates, not promises. Keep larger traffic opportunities visible while tackling the best-supported work first.
How to use Google Search Console to Improve Your SEO
1. Gather Google Search Console Data
Start with a verified Google Search Console property that covers the pages you plan to improve. Record your baseline’s start and end dates. If data is sparse, use the same 56- or 90-day window for every opportunity you compare. When possible, check an equivalent previous period. Review seasonality, promotions, and major site changes that might skew the baseline. Then export the query and URL data you’ll use to estimate added clicks.
Export Query and URL Data with Matching Filters
In Performance → Search results, enable clicks, impressions, CTR, and average position. Set Country: United States and Search type: Web. Keep dates, device, and search appearance filters consistent.
Export the Pages view. Then filter by each relevant URL and export its Queries view to link searches to pages for your click-gain forecast. For query–page datasets you can pull repeatedly, use the Search Console API; interface exports cap at 1,000 rows. Build one working row per query–URL pair from these exports.
Keep the raw exports and clean a working copy. Don’t force row totals to match headline totals. Account for differences between property- and page-level aggregation, anonymized queries, and truncated exports. Also check each query’s Pages tab for multiple ranking URLs before counting them as separate opportunities.
Record Your Forecast Inputs
Use one row per query–URL pair. Record impressions, clicks, current CTR, average position, dates, and filters. Calculate CTR as clicks ÷ impressions × 100, rather than using rounded display values.
Add the planned fix, target position, target CTR or range, effort hours, and confidence level. Treat those targets as tentative until you check them against comparable queries from your site. Include notes on branded intent, seasonality, search-result features, and competing URLs.
Use average position as a guide, not a fixed ranking. Don’t apply a universal minimum impression count. Keep raw rows, group only related queries that the same fix addresses, and lower confidence when data is sparse. These inputs feed the added-click estimates in the next step.
2. Estimate Additional Organic Clicks
Additional clicks = impressions × (target CTR − current CTR). Enter CTRs as decimals: 2% = 0.02. Compare both scenarios over the same 28-day window, and hold impressions constant for the calculation - even though demand and visibility can change. Calculate each opportunity using the query–URL rows from the previous step.
Use this forecast to compare fixes for the same page, query, or cluster.
Choose Realistic Target Positions and CTRs
Start with your historical Google Search Console data to build a site-specific CTR curve. Group comparable queries into rank bands, such as 1–3, 4–5, and 6–10. For each group, divide total clicks by total impressions. The Low-Hanging Fruit Finder runs this scoring on your own Search Console data: it builds your site’s CTR curve and ranks keywords in positions 4–30 by the clicks a realistic ranking gain would add.
Separate mobile from desktop and branded from nonbranded searches when you have enough data. Match search intent and search appearance, too. A single sitewide average can hide important differences. Use generic benchmarks only when your own data is too thin, and mark those estimates as low confidence.
Set targets based on the type of fix:
- Title and snippet changes: Hold position constant and estimate only the CTR lift. Google may rewrite either element.
- Content updates and internal links: Choose a ranking target backed by your site’s past movement - not an unsupported jump to position 1.
- Ranking-conflict fixes: Forecast the net increase in site clicks. Exclude clicks that simply move from one URL to another.
Calculate a Sample Click Forecast
Hypothetical service-page forecast: Over 28 days, a page has 10,000 impressions, position 8, and a 2% CTR: 10,000 × 0.02 = 200 clicks. If a content update reaches position 5 with a projected 4% CTR, the forecast becomes 400 clicks - 200 additional clicks per 28 days. A separate title-change scenario, holding position at 8 and targeting 2.8% CTR, produces 280 clicks - 80 additional clicks. That smaller lift may still rank lower if the content update has higher confidence or lower effort.
Don’t add these gains together unless you model a separate target CTR for the combined change. When the evidence is weak, use a range. In this example, target CTRs of 3%, 4%, and 5% would produce 100, 200, and 300 additional clicks, respectively.
Record the assumptions and confidence beside each estimate. Demand, rankings, search features, and intent can all shift impressions and CTR, so even a higher position may fall short of the forecast.
3. Rank Fixes by Click Gain, Effort, and Confidence
Use the forecast rows from Section 2 to match each opportunity with the fix most likely to add clicks.
Match Each Opportunity to a Fix
Tag each opportunity by its purpose: CTR fix, page-one push (positions 4–10), page-two breakout (positions 11–20), or ranking-conflict fix.
| Fix | Detection signal | Primary traffic lever | Typical effort | Confidence signal | Do next |
|---|---|---|---|---|---|
| Title/snippet improvement | Stable position; CTR below comparable site queries and positions | Higher CTR | 0.5–1 hour | Reliable site-specific CTR data and stable demand | Rewrite the title and meta description to match search intent |
| Content update | Relevant page at positions 4–20; missing or outdated information | Better relevance and position | 2–8 hours | Clear content gaps and a feasible ranking target | Update facts and add missing subtopics |
| Internal linking | Relevant, under-linked page near page one | Possible position improvement | 1–2 hours | Relevant source pages exist; links don’t guarantee movement | Add links from relevant pages |
| Ranking-conflict fix | URLs alternate for a query or overlap in intent | Net click gain | 2–5 hours | Lower when the winning URL, intent, or timing is unclear | Inspect both pages; keep one, separate their intent, merge, redirect, or canonicalize |
Calculate a Priority Score
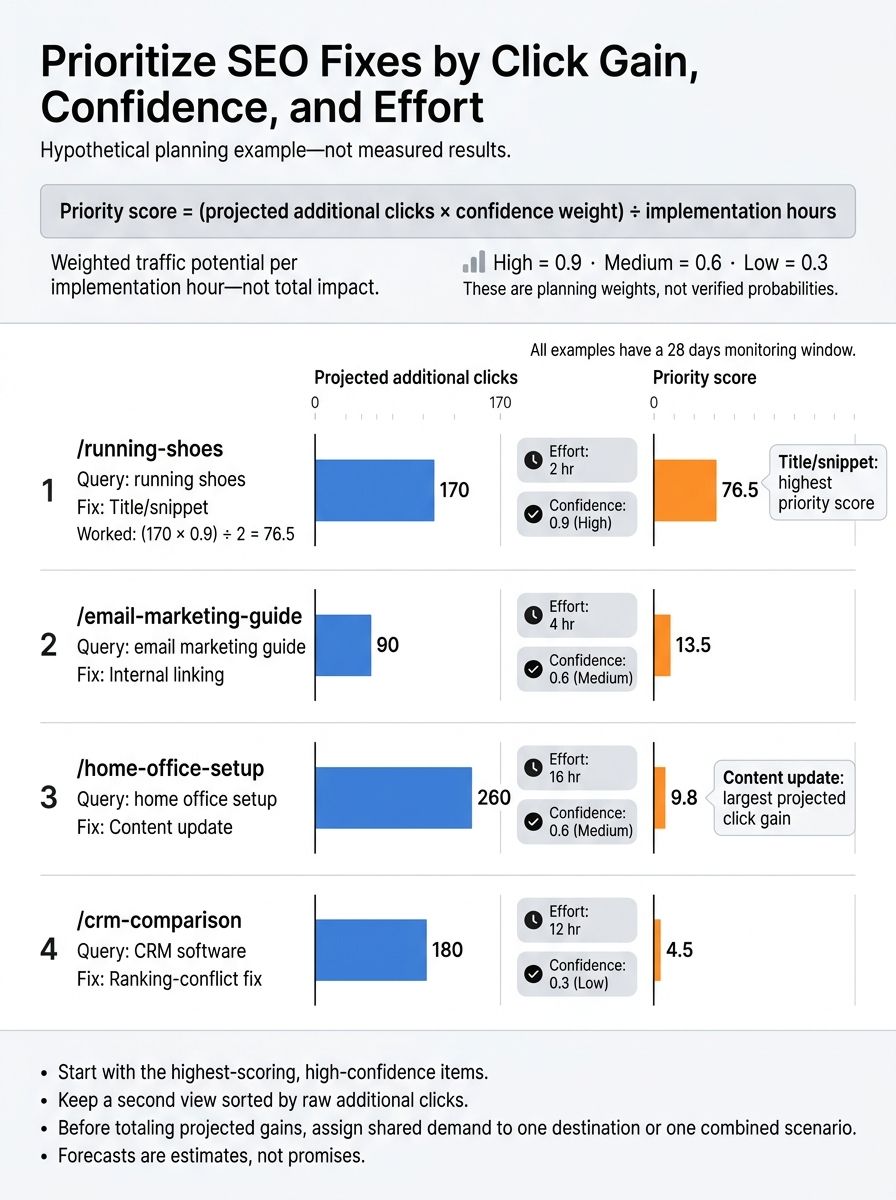
Priority score = (projected additional clicks × confidence weight) ÷ implementation hours.
Use high = 0.9, medium = 0.6, and low = 0.3 as planning weights. Set confidence based on demand stability, intent alignment, CTR evidence, target feasibility, and ranking volatility.
Keep raw click gains visible. The score measures weighted traffic potential per implementation hour, not total impact. Break ties using lower effort, higher confidence, or reach across more related queries.
Track observation time separately. A two-hour edit may still need 28 days of monitoring.
Build Your Prioritized Worklist
The worklist below is a planning example, not a results report. It turns added-click estimates into a ranked action list.
URL Query or cluster Fix Current position Impressions Additional clicks Effort Confidence weight Score Monitoring window Owner Status /running-shoes running shoes Title/snippet 5 10,000 170 2 hr 0.9 76.5 28 days SEO Planned /email-marketing-guide email marketing guide Internal linking 10 4,000 90 4 hr 0.6 13.5 28 days Content Planned /home-office-setup home office setup Content update 14 6,000 260 16 hr 0.6 9.8 28 days Editorial In progress /crm-comparison CRM software Ranking-conflict fix 8 and 15 8,000 180 12 hr 0.3 4.5 28 days SEO Investigating
Start with the highest-scoring, high-confidence items.
Before adding up projected clicks, assign shared demand to one destination or one combined scenario. Keep a second view sorted by raw additional clicks so larger opportunities stay visible alongside quick wins.
4. Implement Fixes and Measure Results
Start with High-Confidence Fixes and Log Changes
Once you’ve ranked the worklist, ship the fix with the highest-confidence click gain first - not the one with the most impressions. Before making changes, log the owner, affected URLs and queries, ship date, and forecasted gain. Record related edits separately so you don’t credit one change for a combined result.
Start with a small batch to make results easier to isolate. Give Google time to process the changes: recrawls can take days or weeks. When changes depend on recrawled content or links, use URL Inspection to check crawl status.
Compare Results and Update Priorities
After shipping a change, measure the same query–URL rows you used for the forecast. In Google Search Console, compare equal-length periods with the same property and filters. Review clicks, impressions, CTR, and position together. For title edits, focus on CTR and position. For ranking conflicts, review all affected URLs as a group.
Click change = post-change clicks − baseline clicks, but that alone doesn’t prove causation. Check seasonal demand, changes to search results, and other logged edits. More impressions with stable CTR may point to higher demand - not better messaging. Compare equivalent seasonal periods when needed, and monitor longer if impressions are too low.
Keep the original forecast beside the measured outcome. Use results from several comparable fixes to update your site-specific CTR curve, effort estimates, and confidence weights. Then rerun the forecast and rescore the worklist.
FAQs
How do I prioritize fixes when traffic and conversion goals differ?
When traffic and conversion goals differ, estimate potential click gains with impressions × CTR gap × feasibility. Focus on high-impression keywords with room to grow - not search volume alone.
Start by improving titles and meta descriptions for keywords ranking in the top five, then add internal links for page-two rankings. Both require little content work. Prioritize projected traffic gains relative to implementation time.
Should urgent technical fixes override my SEO priority scores?
Yes. Fix security issues, manual actions, and indexing failures before working on traffic growth. Start with the problems causing the biggest click losses.
These issues can stop your site from working or being indexed properly. Until you fix them, content updates and ranking improvements may have little effect.
Once those fixes are complete, return to your prioritized list of SEO opportunities and focus on growing traffic.
What should I do if a fix underperforms its forecast?
Diagnose the cause before taking further action. Give Google three to four weeks to recrawl and re-evaluate the page.
If rankings don’t improve, check that redirects, tags, and edits were implemented correctly. Also check for keyword cannibalization, where rankings alternate between two URLs.
If the issue persists, consider adding three to five internal links using the target keyword as anchor text. This gives Google an additional signal.