TUTORIALS
Keylogs will help you to get a deep understanding of what’s happening with your site in the Google search results. This tutorial will help you to get started with Keylogs quickly and gain your first insights.
Getting Started with Keylogs
If you haven’t set up a property yet please log in to Keylogs using the same google account you use for the Google Search Console. Follow the setup wizard and within a few seconds you’ll be set to explore your data.
Hint: If there is no website showing up, or one of your websites is missing in the wizard, please make sure the property is verified at the Google Search Console. Only verified properties can be used with Keylogs.
How Keylogs is structured
Keylogs consists of three major parts: the Dashboard, the Xplorer-section and the Tracker-section. The Dashboard and Xplorer-section use data from the Google Search Console. Currently this data is limited to 90 days and – just like the Search Console – is always a few days behind. Google claims it needs a few days to process the data. That’s why it’s not up to date. You can build up a backlog for your data with Keylogs (more below). But first, let’s find out more about the tree major parts!

The Dashboard – current stats at a single glance
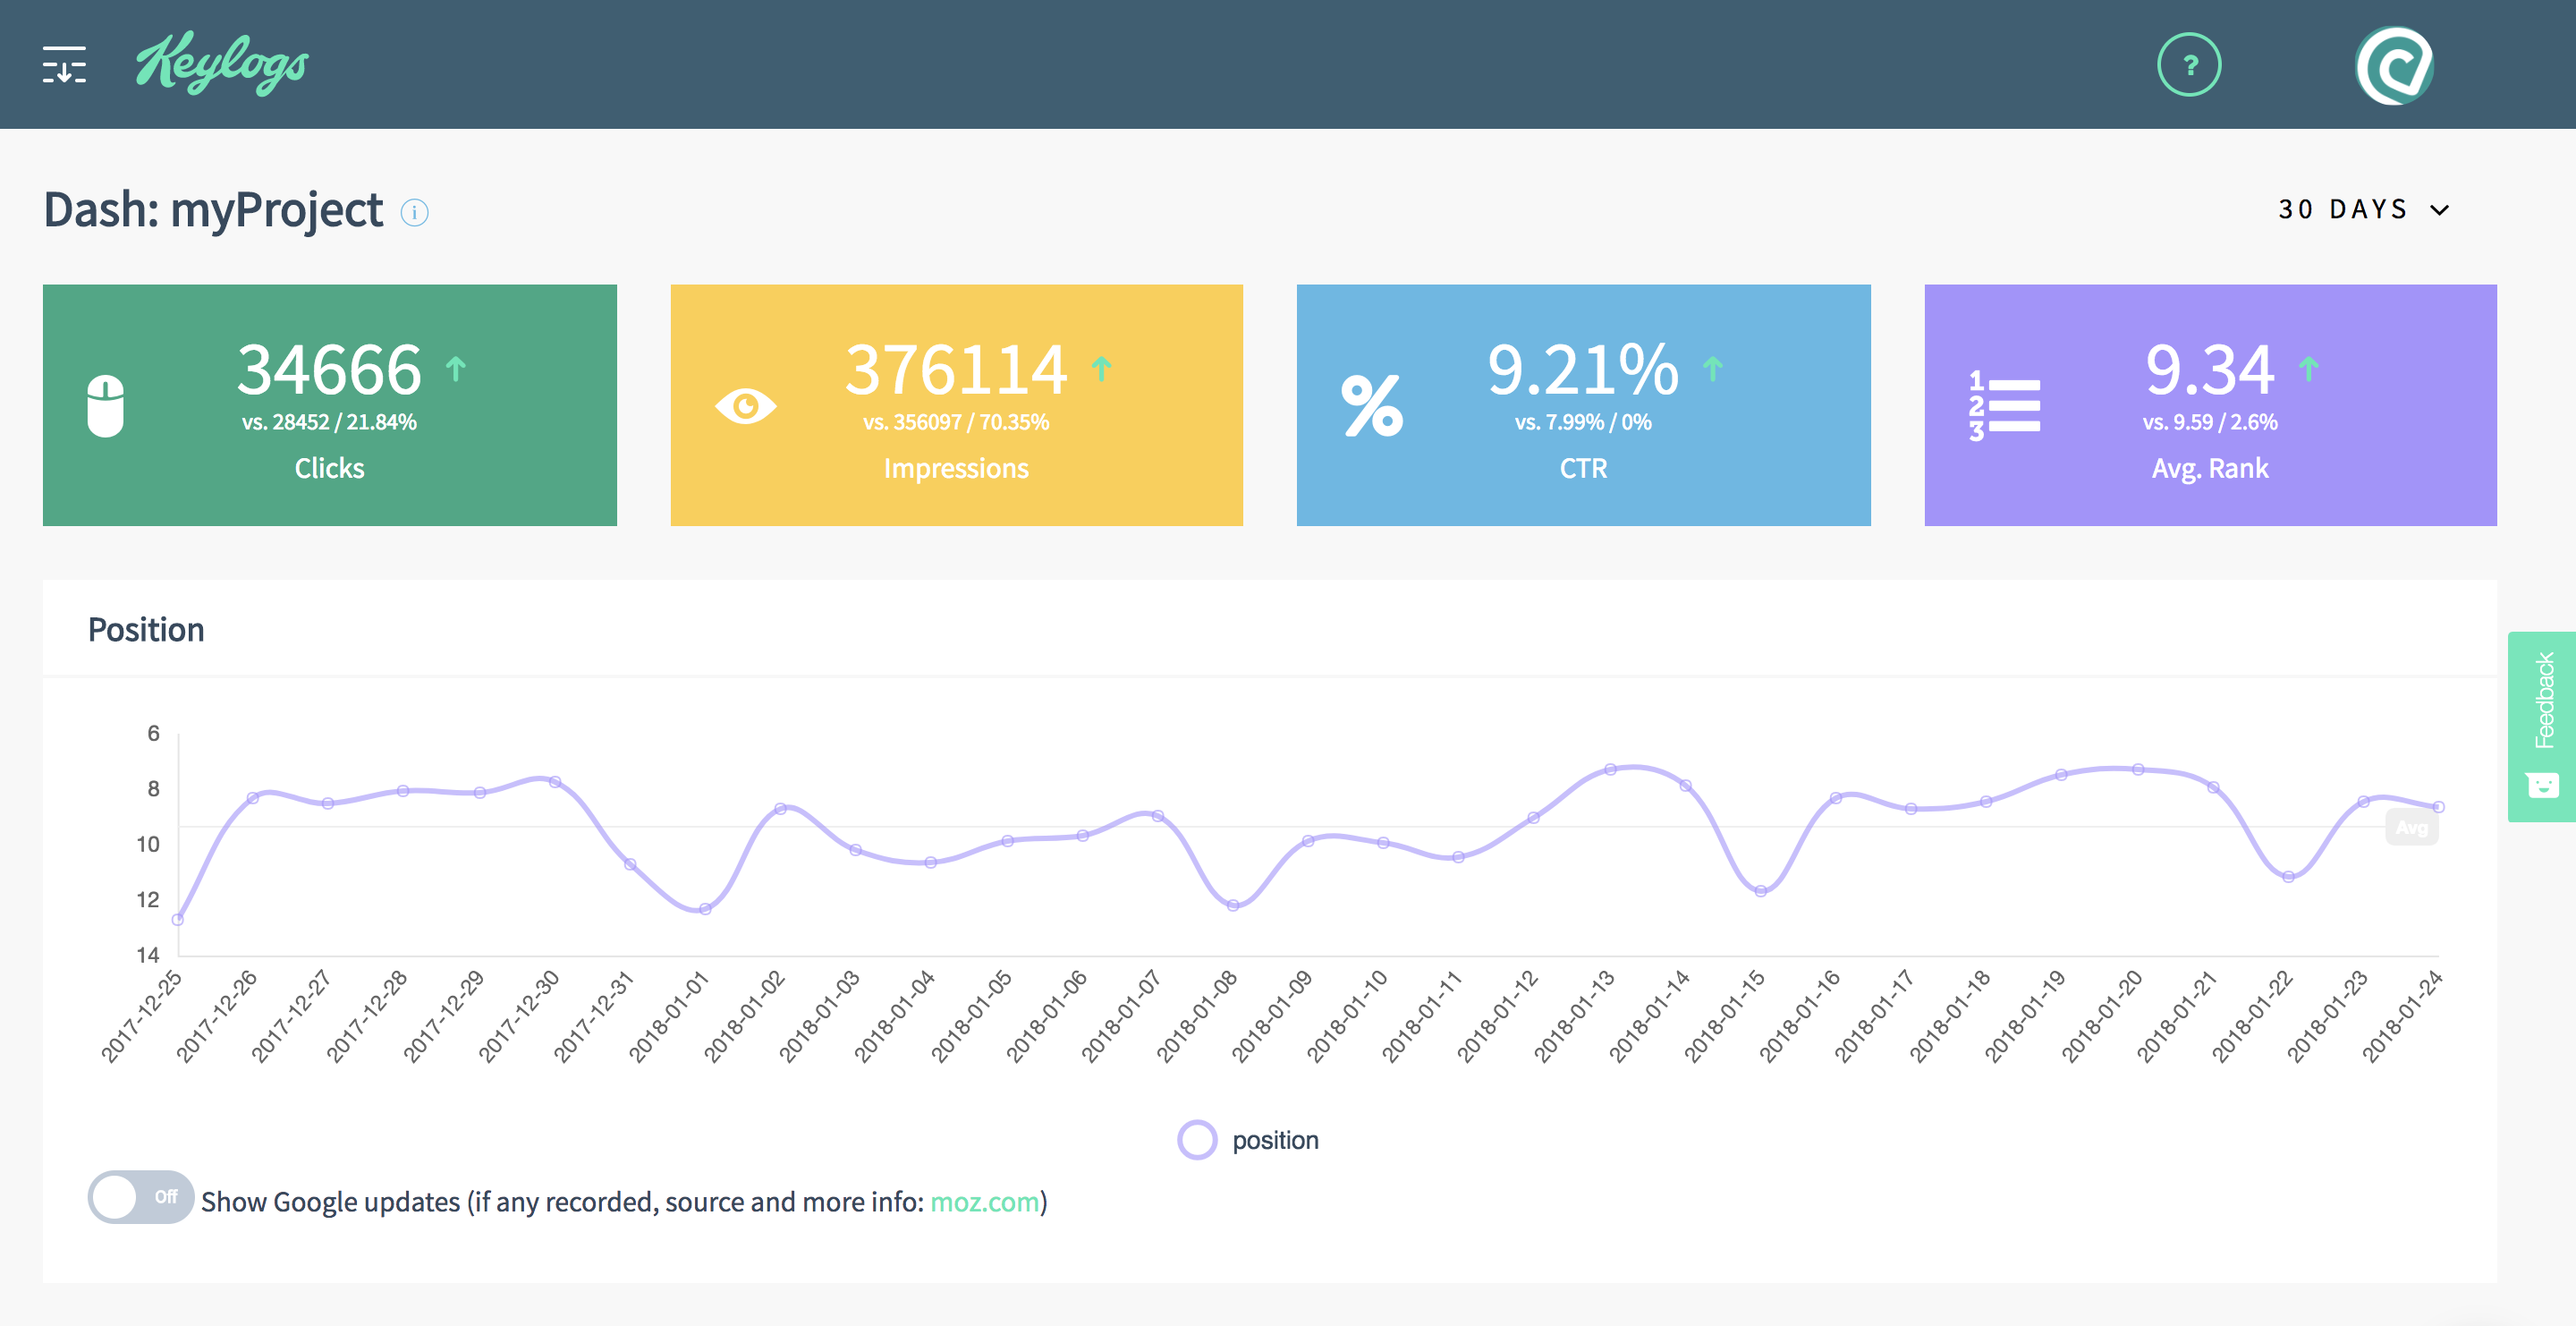
On the dashboard you get a quick overview on how your site is performing. The information will be familiar if you have used the Search Console before. You can easily change the timeframe in the top right. If you scroll down a little you’ll find several tables showing your top pages and keywords as well as those with the biggest change in rank.
You can show known Google updates in the graph – if none shows up it means there are no recorded updates for this timeframe here.
Please keep in mind that the data from Google is always a few days behind and so is Keylogs.

The Explorer Section – find helpful insights instantly
In the PageXplorer you’ll see a list of all your pages ranking for queries on google. Click on the url to see which keywords the page is ranking for. The KeyXplorer works vice versa: it shows all your keywords. Click on a keyword to see it´s ranking pages.
![]()
The Tracker Section – monitor important content longterm and gain deeper insights
If you hit the star icon for a page or keyword, Keylogs will start tracking it’s data in the database and build a backlog with data for more than 90 days. You’ll also be able to mark changes you made to see how they effect your ranking and get deeper insights with data from Google Analytics and even pagespeed insights. We highly recommend to do this for your important content or pages that you are currently growing. Go ahead an give it a go!
Hint: you can track keywords domain wide from the KeyXplorer or filtered for a single page when you star it from the PageXplorer modal.
![]()
What do the colors in the table mean?
To make things easier we added a few colors to the table. Let’s find your most important pages and keywords.
Top performer in yellow
Have you heard of the 80⁄20 or Pareto principle? This principle works on your website as well. It basically means: 20% of your pages or keywords account for 80% of your traffic.
To make it easier for you to identify these pages and queries we have colored them yellow. This means that all the yellow number for impressions (and clicks) sum up to 80% of the total while the black number sum up for the other 20%.
Click through rate in purple
There is a typical distribution of clicks on the first page of google results. Keylogs compares any click-through-rate (CTR) to these base rates. If your CTR is below that it’ll be marked in purple. Find out more how to use this information here.
Table row background green, yellow and white
For further reference to your rankings we’ve colored the background of a row according to the position: green means first page, yellow means second page and white is all the other result pages.
Get started nowHow to go on?
Take a look at our tutorials to find out how Keylogs can help you to: