How Mobile and Desktop CTR Differ by Position
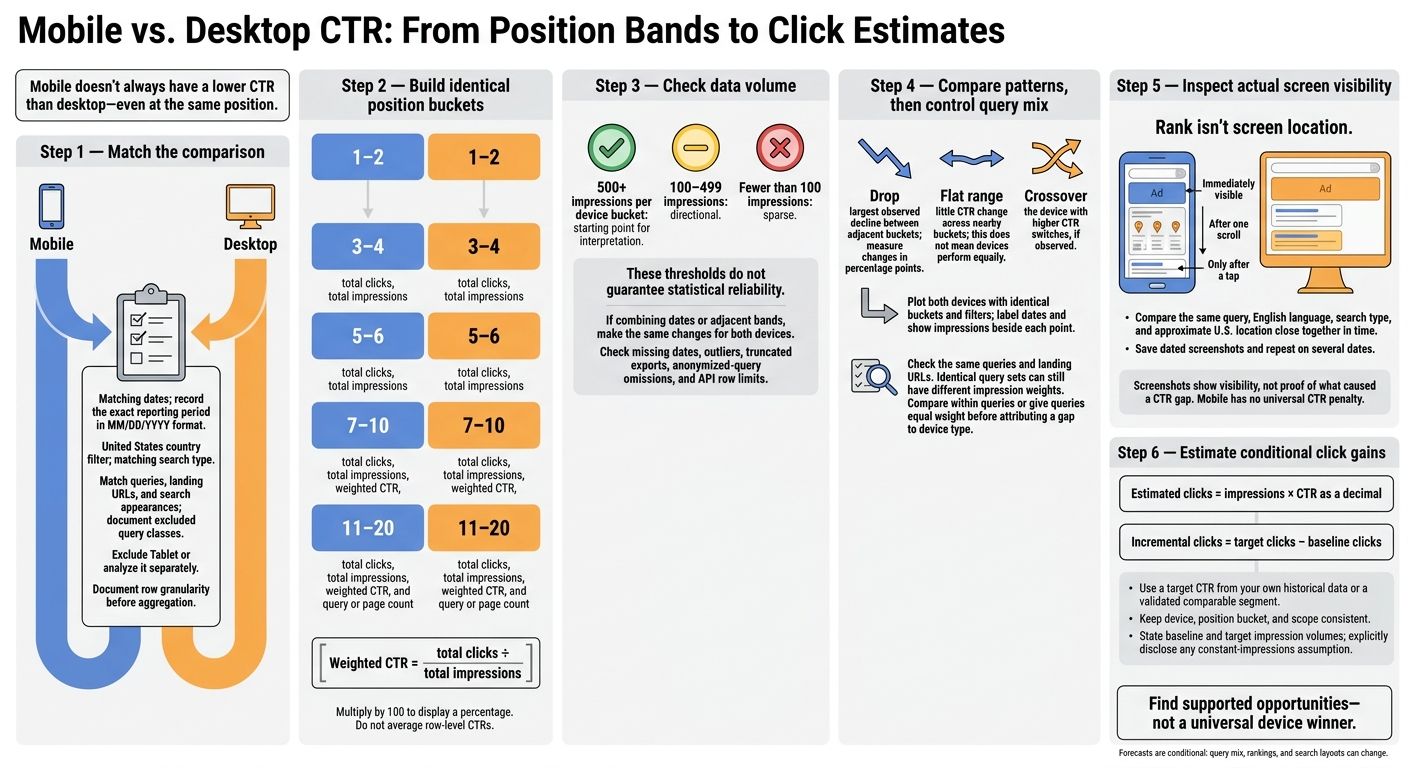
Mobile doesn’t always have a lower CTR than desktop - even at the same position. I compare both using matching U.S. Search Console data and position bands: 1–2, 3–4, 5–6, 7–10, and 11–20. For each band, I divide total clicks by total impressions, rather than averaging row-level CTRs.
· 10 min read

On this page
Mobile doesn’t always have a lower CTR than desktop - even at the same position. I compare both using matching U.S. Search Console data and position bands: 1–2, 3–4, 5–6, 7–10, and 11–20. For each band, I divide total clicks by total impressions, rather than averaging row-level CTRs.
Here’s what I check before treating a device gap as a chance to earn more clicks:
- Curve shape: Where CTR drops, levels off, or switches which device leads.
- Data volume: I use 500 impressions per device bucket as a starting point - not a guarantee of reliable results.
- Query mix: I compare the same queries and URLs with matching dates and filters.
- Screen visibility: I check whether ads and search features push listings out of view. Rank isn’t screen location.
- Click estimates: I multiply impressions by a target CTR from matching data and state my assumptions.
The goal isn’t to pick a device winner. It’s to find where your data supports a change - and estimate how many clicks that change could bring.
1. Mobile CTR by Position
CTR by Position Range
Group mobile average positions into non-overlapping bands: 1–2, 3–4, 5–6, 7–10, and 11–20. For each band, report impressions, clicks, weighted CTR, and the number of queries or pages. Include the reporting period, and mark bands with low impressions as unstable.
CTR Curve Shape
Look for a sharp drop between the top bands, followed by a flatter tail. Positions 1–2 may have the highest CTR, with declines at 3–4 and 5–6 before the curve levels off at 7–10 and 11–20. But let the data set the shape, rather than assuming this pattern will hold.
Use the mobile curve to identify where clicks start to level off before comparing it with desktop.
An increase in CTR may reflect branded queries, search intent, or search features. Separate branded and nonbranded queries, then review the queries with the most impressions before drawing conclusions.
SERP Visibility
Average position isn't a location on the screen. On phones, ads, local packs, shopping modules, and video results can push organic listings below the initial viewport. Even a high-ranking result may sit below the fold, while lower results can still earn clicks from people who scroll.
Review mobile queries with high impressions on a phone. Take screenshots and check what appears above your listing before attributing low CTR to rankings alone. Focus on mobile queries in positions 3–10 where the search layout and snippet point to a realistic chance of earning more clicks.
Use this mobile curve as the baseline for the desktop comparison.
2. Desktop CTR by Position
Build the desktop CTR curve using the same position bands so you can compare it directly with mobile.
CTR by Position Range
In Google Search Console, filter to Device = Desktop. Use the same bands as your mobile analysis: 1–2, 3–4, 5–6, 7–10, and 11–20. Report clicks, impressions, CTR, and query or page counts for each band.
CTR Curve Shape
Compare desktop and mobile CTR at matching positions. Find the steepest drop from the top bands and note where the curve flattens. If a lower band performs unusually well, check its highest-impression queries before dismissing the result as noise. Treat bands with few impressions as directional only.
Don't assume desktop CTR is higher. Match queries, pages, countries, dates, search types, and URLs before interpreting a gap. Differences in query mix and intent can change the curve. Google also notes that location-seeking queries may perform better on mobile.
If the curve looks unusual, check the desktop results page before attributing the gap to rank alone.
SERP Visibility
Desktop layouts can produce different CTRs even at similar rankings. A knowledge panel may appear beside or above organic results without a matching organic position. Ads can also take up space without organic position numbers.
For strong rankings with weak CTR - or rising impressions with flat clicks - review the full SERP for competing features before changing titles or descriptions.
Compare Mobile and Desktop CTR Curves
Plot both curves together to see where mobile and desktop clicks differ by position. Use identical filters and matching average-position buckets. Label the start and end dates, and show impressions beside each point. Calculate each bucket’s CTR from total clicks and total impressions, not row-level CTRs. Then look for places where the curves move apart, flatten, or cross.
CTR Drops, Crossovers, and Flat Ranges
Measure changes between adjacent buckets in percentage points. A crossover marks the bucket where the device with the higher CTR changes. A flat range means CTR changes little - not that both devices perform equally. To examine positions 4–10 more closely, rebuild both curves using matching, narrower bands.
| Curve feature | Mobile finding | Desktop finding | Caveat |
|---|---|---|---|
| Largest CTR drop | Largest observed decline between adjacent buckets, if any | Largest observed decline between adjacent buckets, if any | Requires bucket CTRs and impressions |
| Flat ranges | Nearby buckets with similar CTRs | Nearby buckets with similar CTRs | Small gaps may be noise |
| Device crossover | Bucket where device ordering flips, if any | Bucket where device ordering flips, if any | Verify by query and URL |
If the gap remains after segment checks, inspect the SERP layout behind it.
Minimum Impressions and Data Limits
Use 500 impressions per device bucket as the baseline for interpretation to reduce false signals from small samples. Treat 100–499 impressions as directional and fewer than 100 as sparse. These cutoffs don’t guarantee statistical reliability. Combine dates or adjacent bands when needed, making the same changes for both devices.
Check for outliers, missing dates, shifts in the reporting window, and truncated exports. Search Console leaves anonymized queries out of query tables. Unfiltered chart totals include them unless a query filter is applied, so query rows may not match chart totals. API extraction also has row limits.
When your data represents your site’s search demand, your own curves offer a better planning baseline than published averages. Next, test whether the gap holds at the query level.
Check Query Mix and Segments
Control for query mix before attributing a gap to device type. Even identical query sets can have different impression weights across devices. Compare CTR within the same queries, or give queries equal weight, before calling the gap device-driven.
Investigate unusual reversals by query and landing URL. Competing pages or changes in which URL appears can alter the curve without proving that rankings changed.
How Search Layouts Affect Organic Visibility
If mobile and desktop curves diverge at the same positions, check where the result appears on the screen. After controlling for query mix, test layout first when investigating a crossover, steep drop, or flat range. Search Console average position is a rank, not a screen location.
Screen Size, Scrolling, and Result Visibility
Mobile’s narrower viewport usually shows less content at once. But standard web-result impressions can count when the page loads - even if the link sits below the visible screen. Users may need to scroll or tap to reach a result, while desktop can display several elements together.
Record whether the result appears immediately, after one scroll, or only after a tap. Don’t assume mobile results face a universal CTR penalty.
Ads, Local Results, and Search Features
Google can change result layouts based on device, location, query, and user context. Ads take up screen space but don’t receive a Search Console position number. Compare the same query on both devices and record what appears above the organic result.
| Layout factor | Mobile effects | Desktop effects | Checks needed to interpret the CTR gap |
|---|---|---|---|
| Viewport and scrolling | Less content visible at once | More elements may fit together | Record visibility immediately, after one scroll, or only after a tap |
| Ads | May fill much of the initial screen | Can still take up much of the space above results | Record ad count, placement, and target-result visibility |
| Local results | Maps and call actions may stack above links | Maps or panels may spread across more screen width | Match U.S. location; separate local and nonlocal queries |
| Featured snippets | May take up much of the vertical space | May show more answer text at once | Record snippet ownership and placement relative to your link |
Review Search Layouts for Sample Queries
After comparing the curves, review sample queries to test whether layout could explain the gap. Choose high-impression queries across branded, informational, local, commercial, and navigational intent, covering several position ranges.
Check mobile and desktop results close together in time. Use the same query, English language, search type, and approximate U.S. location. Save dated screenshots and record the device, viewport, visible features, target URL, observed result order, and scroll depth.
A spot check is only a snapshot. Repeat checks on several dates to see whether the layout persists. Screenshots show visibility, but they can’t prove what caused the CTR gap. Use them to estimate how layout may shift expected clicks.
Conclusion: Estimate Clicks by Device and Position
Report only the gaps your segmented data supports. Don’t name a universal device winner. To turn device curves into click estimates, apply CTR to impressions:
Estimated clicks = impressions × CTR as a decimal.
Keep the device, position bucket, and scope the same. Then calculate incremental clicks = target clicks − baseline clicks. State both baseline and target impression volumes. If you assume impressions stay constant, say so.
Use a target CTR from your own historical data or a validated comparable segment. The forecast is conditional: query mix, rankings, and search layouts can change. Keylogs can help prioritize opportunities by traffic impact and flag keyword cannibalization.
Use this checklist to match the estimate to the scope of your curves:
- Dates and filters: Record the exact period in U.S. date format (MM/DD/YYYY), the United States country filter, and search type.
- Devices and scope: Keep Mobile and Desktop separate. Exclude Tablet or analyze it separately. Record included queries, URLs, search appearances, and excluded query classes.
- Rows and buckets: Document row granularity before aggregation, and use consistent position buckets.
- CTR and data limits: Use weighted CTR - not an average of row CTRs. Disclose the minimum impression threshold for each device-position bucket.
- Forecast assumptions: Record baseline and target impressions, the source of the target CTR, and the conditions required for the gain.
FAQs
How can I tell if a device CTR gap is statistically meaningful?
Compare your site’s query CTRs within position bands, such as 1–3, 4–5, and 6–10. Review mobile and desktop separately, and flag queries with CTRs well below your site’s baseline for the same device and position band.
If mobile CTR trails desktop CTR, compare like with like: use the same date range, filter for non-branded queries, and match search intent.
How often should I update my CTR curves?
Update your CTR curves once you have enough new Search Console data for reliable estimates. Pay particular attention after title or snippet edits, content or internal-link updates, or major changes to your site or search results.
Keep comparison windows consistent: use 28-day periods to monitor changes after updates, or complete calendar months for reporting baselines. Apply the same filters for country, device (mobile vs. desktop), search type, and search appearance so you’re comparing like with like.
How can I test whether snippet changes improve CTR?
Check search intent, the visible title and meta description, and the page’s ranking. If the snippet doesn’t match intent, revise it while keeping it aligned with the page’s content.
Record the change date. Compare clicks, CTR, and position over the next four weeks against the previous four weeks. Use the same device, country, and query filters for both periods.
Google may rewrite snippets on its own. Watch CTR and position trends rather than assuming your edit caused an immediate change.